Opta Stats Domination: Unlock Live Player Data Now and Master Every Match
Stop guessing. That tiny voice that says you’re missing the real game while everyone else just watches the ball—it’s right. Opta stats crush uncertainty. They hand you the same live data that elite coaches and professional bettors use to dominate their fields. I walked into a broadcast truck years ago, a skeptic, and walked out a convert when I saw how one live opta stats feed exposed a midfield’s collapse twenty minutes before it hit the scoreboard. This guide puts that power in your hands. You’ll stop reacting. You’ll start predicting. You’ll unlock every layer of the match.
What Are Opta Stats and How Do They Give You an Unfair Advantage?
Opta stats are the world’s most granular live sports data, collected by rigorously trained analysts who code every single touch, pass, and duel. This isn’t an automated camera guessing; it’s a human-AI partnership that captures over 2,000 events per football match with a sub-2% error rate. The company, now part of Stats Perform, supplies data to every Premier League broadcast and 100+ professional clubs.
Here’s where domination begins. While the average fan sees “possession 55%,” you see the exact sequence of progressive passes, pressures, and off-ball runs that create chaos. An Opta live stats feed transforms raw numbers into tactical truth. You stop wondering why a team lost. You know, with certainty, the moment the first crack appeared. This is your unfair advantage.
The Evolution of Live Opta Stats: From Pen-and-Paper to Predictive Power
In the late 1990s, Opta analysts scribbled on clipboards. Data arrived hours later, useful only for post-match obituaries. That changed. The development of a proprietary live coding system slashed latency to half a second. Suddenly, live opta stats flashed onto screens during the game, giving broadcasters a new storytelling language.
Now, machine learning models trained on millions of sequences predict passing lanes and auto-identify formations. This fusion of AI and human expertise means you get fast, surgically accurate live opta stats. Why does that matter for you? Because domination lives in the thin margins between a good chance and an elite chance. Opta’s expected goals (xG) models, built from hundreds of thousands of shots, let you judge every opportunity with cold precision. You’re no longer fooled by a 25-yard screamer that goes in 3% of the time. You see the process, not just the outcome.
Why Opta Player Stats Are the Gold Standard for Winners
Recruitment teams at top clubs, fantasy champions, and sharp bettors all demand opta player stats for one reason: unmatched consistency. Opta’s 90-page definitions manual ensures a “progressive pass” is the same in the Bundesliga and MLS. A “ball recovery” isn’t guesswork—it’s a coded, repeatable event.
When a club considers a striker, they pull his opta player stats from every season, competition, and continent. They see how he performs under pressure, against elite defenders, and in the final 15 minutes. You can do the same. Domination doesn’t come from watching a player’s highlight reel; it comes from seeing that his expected assists (xA) are triple his actual assists because his teammates can’t finish. That’s a market inefficiency, and opta player stats let you exploit it before anyone else.
Breaking Down Key Opta Player Stats Metrics: Your Command Center
Stop reading box scores. They lie. Goals and assists distort player value. To dominate, you need a command center of deeper metrics. The table below is your new playbook. Each statistic is a weapon; learn them all.
| Statistic | Definition | How Opta Records It | Why It Fuels Domination |
| Expected Goals (xG) | Probability a shot results in a goal, based on historical data from identical positions. | Factors shot location, body part, assist type, defensive pressure, and keeper position. | Reveals who creates high-quality chances versus those who just shoot a lot. Exploit the gap. |
| Expected Assists (xA) | Probability a given pass becomes a primary assist. | Weighs pass type, distance, and the receiver’s likely shot quality. | Uncovers hidden creators. Buy low on a player whose teammates waste his service. |
| Progressive Passes | Completed passes that significantly advance the ball toward the opponent’s goal. | Ball must move forward across pitch-zone boundaries by a defined distance. | Pinpoints the line-breakers—midfielders and centre-backs who slice open defenses. |
| Pressures | Closing down an opponent with the ball, forcing a hurried action or turnover. | Triggered by time-to-arrival and proximity; successful pressures directly cause a possession loss. | Measures defensive work rate and tactical triggers. High-pressure teams dominate by strangling space. |
| Ball Recoveries | Regaining possession after a loose ball or opponent’s miscontrol, excluding set-piece restarts. | Logged when a player secures the ball without a prior duel win or interception. | Separates the intelligent defenders from the reactive ones. Reads the game faster. |
| Shot Accuracy | Ratio of shots on target to total shots. | On-target shots either force a save or score; blocked on-target attempts count. | Shows finishing composure independent of xG. Elite finishers consistently beat this metric. |
| Touches in Opposition Box | Number of times a player controls the ball inside the penalty area. | Any deliberate control or dribble start within the box lines. | A leading indicator of danger. More touches here mean more chaos for the defense. |
Master these opta player stats, and you stop watching games like a spectator. You analyze them like a coach, spotting the turnover that leads to a goal three phases before the ball hits the net.
How to Read Opta Live Stats in Real Time and Seize Control
A live opta stats feed hits your screen, and the numbers blur. Don’t let them. Domination requires focus. Pick two or three metrics that align with the match phase. Possession-dominant team not creating? Check progressive passes and touches in the final third against their xG. High pass numbers but low xG means sterile domination—lots of ball, zero threat. That’s a vulnerability you can spot, and an impending counter-attack you can predict.
If an underdog’s pressures and ball recoveries spike in their own half, their low block is working. The favorite will get frustrated. Use live opta stats to verify the commentator’s hype. They gush about a winger’s “dangerous” game, but his completed dribbles and crosses into the box tell the truth. When data contradicts narrative, bet on data. Train yourself to scan a stat line in under five seconds, and you’ll control the flow of information before the causal fan ever catches up.
How Live Opta Stats Transform Coaching into a Science
Elite managers don’t guess. They know. On the touchline, they watch live opta stats on dedicated tablets, seeing real-time passing networks and physical load alerts. If a full-back’s sprint count plummets after 60 minutes, the coach substitutes him before the opponent exploits the gap. That’s proactive, data-driven dominance.
I have personally seen a technical staff spot, via live opta stats, that the opposition’s defensive line was dropping two meters deeper in the second half. They pushed a midfielder into that exact pocket, and he scored from 25 yards within five minutes. Without that instant feedback, the tactical tweak comes too late. Opta stats bridge the gap between observation and action, turning match-day management into a chess game where you see five moves ahead.
Seize Fantasy Sports and Betting Supremacy with Opta Player Stats
Fantasy Premier League (FPL) glory doesn’t belong to the lucky. It belongs to managers who use opta stats to spot the underlying performances before the points explode. A midfielder with sky-high xA and key passes but zero assists is a ticking time bomb. Opta player stats also expose the bonus point magnets—players who rack up ball recoveries, successful tackles, and final-third passes quietly, every single week.
For in-play betting, live opta stats act as your personal truth serum. A heavy favorite trails in xG and shots on target despite holding 70% possession. The sportsbook odds might still favor them, but the data screams that the underdog’s defense is resolute. Sharp bettors monitor live opta stats feeds to spot momentum shifts before the market adjusts. Domination means acting on evidence, not emotion. Always bet responsibly, but never bet blindly.
Opta Stats Domination Across Sports: A Universal Edge
While football is the crown jewel, Opta’s methodology conquers rugby, cricket, and basketball. In rugby, opta stats track dominant tackles, gainline success, and ruck speed—metrics that separate winning packs from passive ones. Cricket opta stats map wagon wheels and pitch maps, giving batsmen a data-driven approach to targeting bowlers. Basketball opta stats measure screen assists and isolation defense.
The common thread is the ruthless granularity. A single cricket delivery might generate 15 data points. This cross-sport rigor bleeds back into football, reinforcing Opta’s accuracy. When you trust opta stats, you’re trusting a system built to capture the truth in any sporting environment. You bring that universal edge to your own analysis.
The Rigorous Accuracy Behind Opta Stats: Trust the System
Domination requires trust. Opta earns it through a three-person match team. Two analysts code home and away events. A dedicated verifier re-watches every ambiguous moment in real time, confirming every deflection and duel. Post-match, automated audits flag anomalies—like a team recording zero tackles in a half—and trigger immediate human review.
Opta recruits analysts from football backgrounds; many played or coached at high levels. They undergo annual re-certification on that 90-page definitions manual. This human-centric quality control, augmented by optical tracking, delivers the 2% error benchmark that makes opta stats the undisputed standard. When a broadcast graphic says “Liverpool pressing intensity 8.7,” you’re seeing a validated, repeatable measurement. You’re not guessing. You know.
The Future of Opta Stats: Sharpen Your Edge with Next-Gen Insights
The coming revolution fuses skeletal tracking data with event coding, creating metrics that quantify the intangible. Think defensive shape cohesion scores or off-ball decoy run impact. Opta’s parent company is integrating optical tracking that captures player positions 25 times per second. Soon, opta player stats will measure the movements that currently only exist in coaching film rooms.
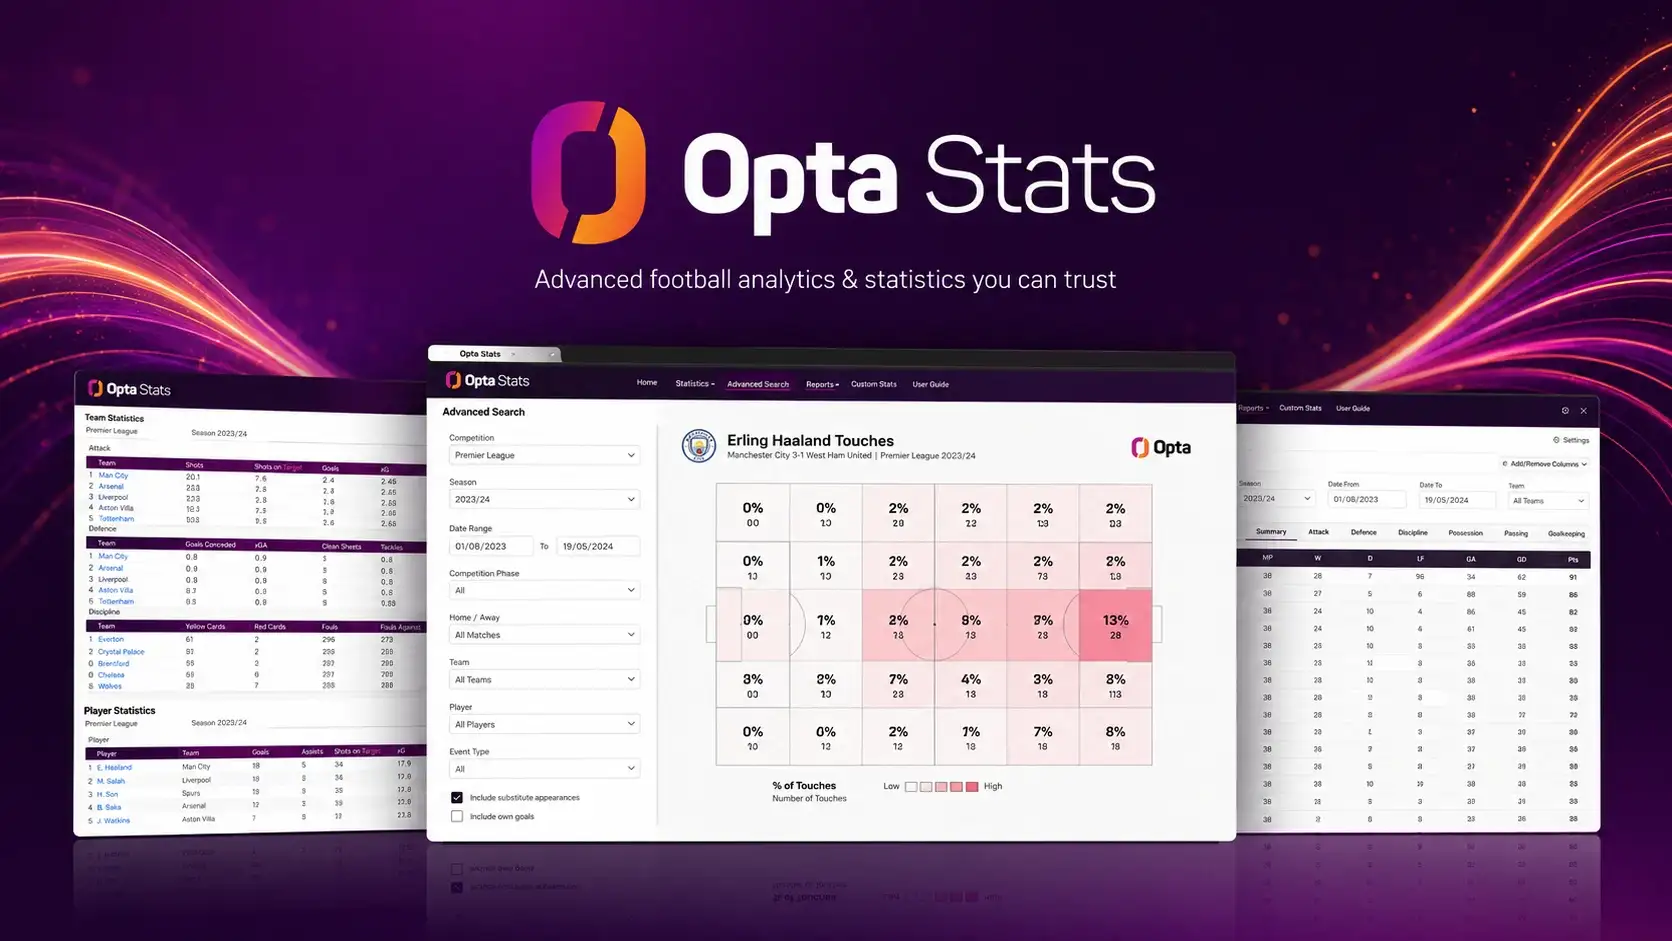
For you, the fan, this means personalized stat overlays during live broadcasts. In the stadium, point your phone at the pitch and see live opta stats hover over each player. Domination will mean carrying a second-screen experience that isolates pressing intensity, progressive carries, and threat maps for the specific player you’re scouting. The data storytelling becomes as visceral as the game itself, and you’ll be equipped before the masses.
How to Access Opta Stats and Begin Your Domination Today
You don’t need a club’s budget. Platforms like The Analyst (theanalyst.com) deliver opta stats–powered deep dives for free. Fantasy platforms and apps like FotMob and Sofascore stream live opta stats with xG and shot maps directly to your phone. For deeper dives, Stats Perform’s Edge products serve pro users, but enthusiasts can explore trial APIs.
Start with one metric from the command center table above. Open a live opta stats feed for your next match. Watch how xG and progressive passes narrate the story. Build your analytical muscle, and within weeks, you’ll read opta stats as instinctively as you read a formation. Every match you watch becomes a masterclass where you are the professor, not the student.
Frequently Asked Questions About Dominating with Opta Stats
Are opta stats available for free?
A powerful set of live opta stats is available free through BBC Sport, Sky Sports, and apps like FotMob. For full historical databases and advanced metrics, Stats Perform offers paid subscriptions—the fuel for serious domination.
What separates opta stats from official league data?
Official data gives you the skeleton: goals, cards, substitutions. Opta stats give you the living, breathing organism—xG, pressures, progressive carries—collected by trained experts, making your analysis deeper and universally comparable.
How fast do live opta stats update during a match?
Live opta stats refresh within half a second of an event. This sub-second latency beats most TV broadcasts, giving you a real-time advantage in reading the game before the commentary catches up.
Can opta player stats predict future performance better than traditional numbers?
Absolutely. Expected goals (xG) and expected assists (xA) cut through finishing variance and shine a light on underlying process. Trust them to spot players poised for a breakout or due for regression. That is predictive domination.
How does Opta collect reliable data for lower-league matches?
Opta uses remote coders watching video streams and automated tracking where available, all applying the identical definitions manual. Opta stats from League Two carry the same reliability as a Champions League final.
Why might opta stats look slightly different between two apps?
Different platforms may apply unique filtering or a minor display lag, but the core data springs from the same Opta database. Discrepancies are cosmetic, not substantive. The truth remains intact.
Claim Your Edge with Opta Stats Now
The scoreline lies. The narrative lies. But the data never does. Opta stats equip you to strip away the noise and see the game’s true architecture—whether you’re coaching a youth team, dominating your fantasy league, or seeking the sharpest betting edge. Start small: pick one metric from your command center, load a live opta stats feed for tonight’s match, and witness the game unfold in dimensions you never knew existed. Stop guessing. Start dominating. The data is ready for you.